


Various interrelated factors, including production levels, storage capacity, market dynamics for power demand, gas imports, LNG exports, and weather conditions, shape North American natural gas markets. How each of them affects the cost of the commodity, explained Edward Nikulin, weather model expert, Mind Money.
Storage capacity in Europe will remain 24% lower than average in 2024, while in the U.S., it will be 25% lower than in 2024, forcing operators to buy gas at any price. Various interrelated factors, including production levels, storage capacity, market dynamics for power demand, gas imports, LNG exports, and weather conditions, shape North American natural gas markets.
U.S. storage capacity
As of March 7, U.S. working natural gas inventories totalled 1,698 billion cubic feet, a net decrease of 62 Bcf from the previous week and 628 Bcf less than last year at this time. Previous estimates submitted to Reuters ranged from withdrawals of 83 Bcf to 118 Bcf, with a median of 92 Bcf. Bloomberg’s polling produced a narrower range and also landed at a median of 92 Bcf. NGI modelled a 90 Bcf withdrawal.
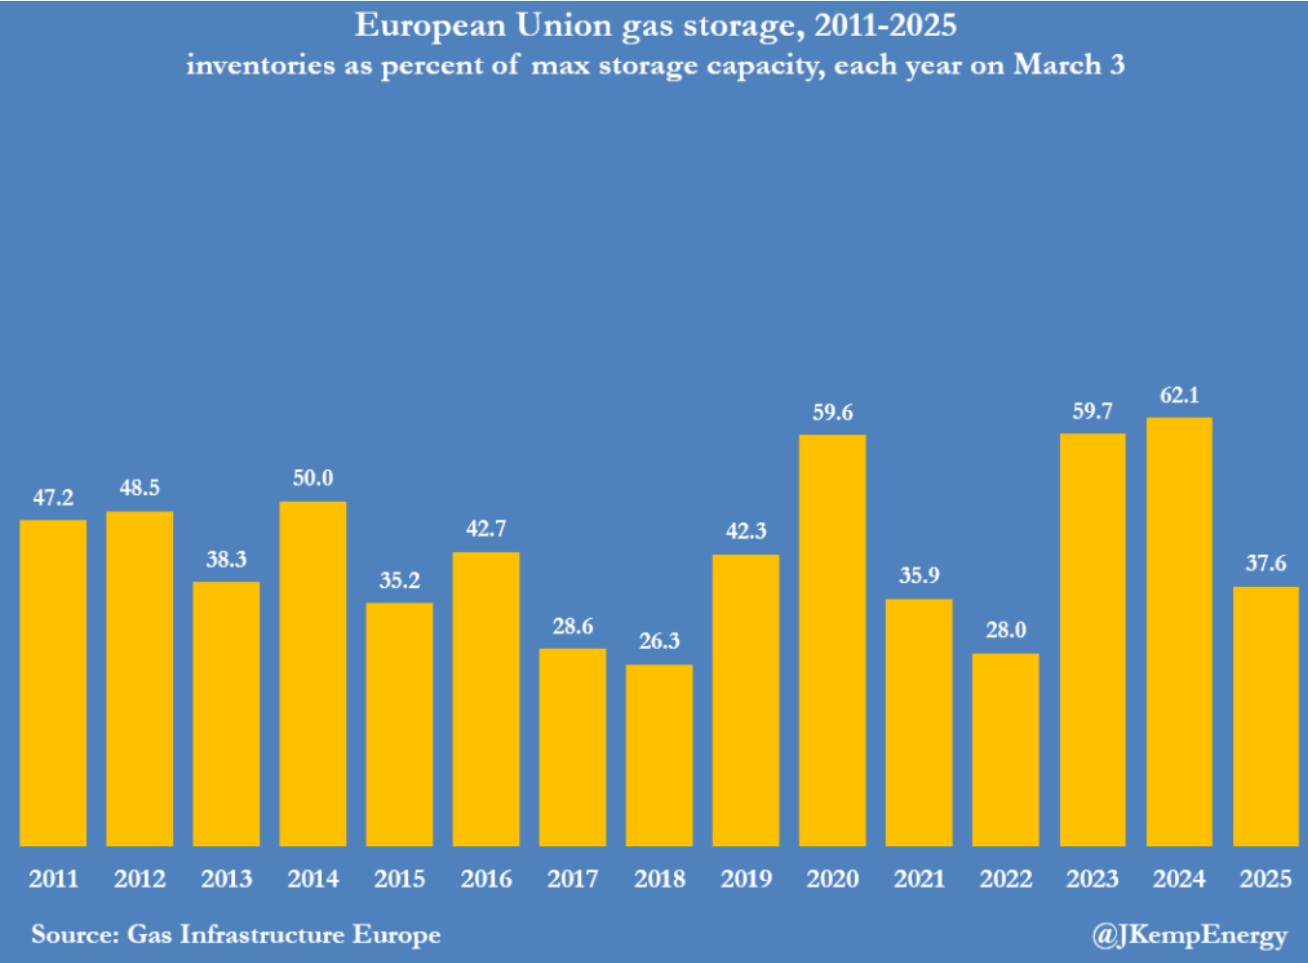
Storage capacity in Europe is well below average
Recently, the European Commission adopted intermediate targets for EU countries’ gas consumption. For 2025, it outlined to ensure gas storage facilities to be filled to at least 90% of capacity by 1 November 2025, as required by the EU Gas Storage Regulation. However, adverse weather conditions in February 2025 have led to a more rapid depletion of Europe’s gas reserves during winter, causing seasonal price fluctuations that have made it unfeasible to replenish inventories over the summer. Although traders are experiencing a slight easing of supply concerns, uncertainty continues to loom over the market, keeping them cautious and alert.
As of March 3, Europe’s gas storage facilities were reported to be only 38% full, which is significantly lower than last year’s ~62% and 8% less than the 5-year average, indicating that less than a month of winter depletion remains. Typically, gas storage levels reach their lowest point around the end of March. The legally controlled target to replenish gas storage to 90% capacity by November 1 forces the operators to buy gas at any price.
How does this affect the price of gas?
As both the U.S. and Europe transition out of winter, they find themselves with lower-than-average gas stockpiles, resulting in rising prices. The situation has already pushed U.S. Henry Hub gas futures to multi-year highs due to fears of dwindling supplies. In Europe, the combination of low inventories and enforced replenishment targets has driven prices to two-year highs in the late winter weeks, as the market gears up for strong demand over the summer.
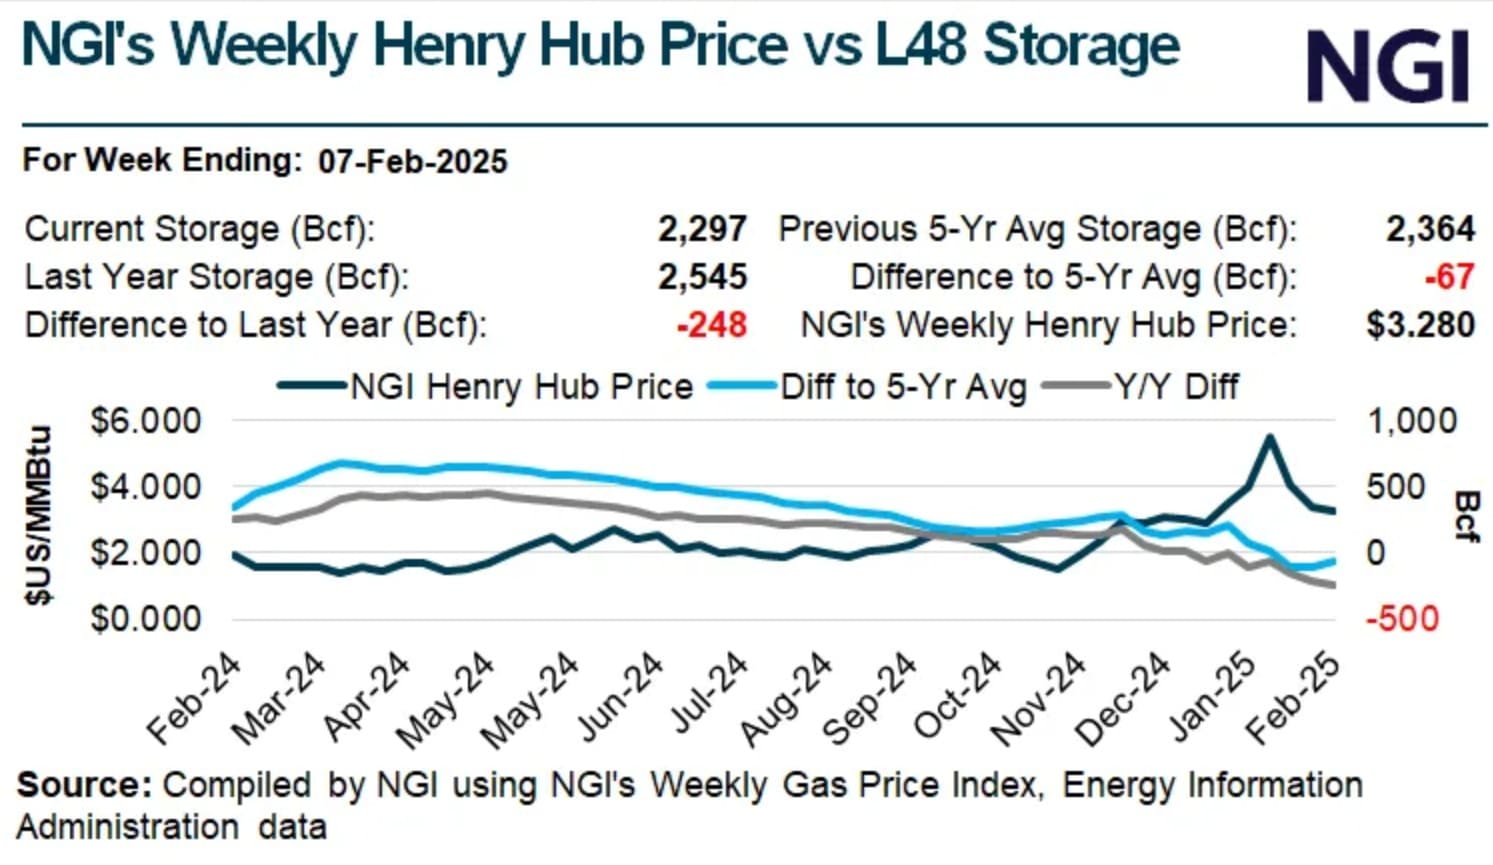
Low natural gas stockpiles in the U.S.
According to Reuters, as of mid-March 2025, gas stockpiles remained about 12% below normal levels for this time of year after extreme cold in January and February forced energy firms to pull massive amounts of gas out of storage.
How does this affect the price of gas?
Because of regulatory uncertainty, production is not growing fast enough to compensate for tight inventories and rising demand. The lack of surplus pushes prices higher.
Tariffs on imports from Canada
On March 4, the U.S. implemented a 10% tariff on Canadian natural gas, which accounted for about 8-10% of the country’s gas consumption. Consequently, Canadian natural gas exports to the U.S. dropped from approximately 9.8 Bcf/d to 8.2 Bcf/d, as several shipments faced delays or changes in routing.
The ongoing situation has elevated expectations regarding a possible trade war between the U.S. and Canada, contributing to uncertainty in the gas market.
Reducing imports from Canada directly impacts the supply-demand dynamics in the U.S. These pipeline imports play a crucial role in meeting the needs of consumers in the Midwest and Northeast. Any reduction in these imports means that U.S. storage or production must compensate for the shortfall.
Expected growth of data centers’ power consumption
As data centers expand, their power consumption is driving a growing demand for natural gas. In 2023, these centers represented about 4.4% of the total electricity consumption in the U.S., and projections suggest this could rise to between 6.7% and 12% by 2028, propelled by advancements in AI, cloud computing, and data streaming.
The Energy Information Administration (EIA) anticipates a 2% increase in U.S. electricity demand by 2025, largely due to the increasing load from data centers. This escalation is expected to boost natural gas usage, which currently makes up approximately 41-43% of the U.S. electricity generation mix.
Reduced weather risks due to the end of winter and polar vortex dynamics
As March weather patterns take over the typical February chills, the influence of cold temperatures on gas prices is starting to ease. Early in 2025, the polar vortex caused significant disruptions, allowing Arctic air to spill into the mid-latitudes. During January and again in mid-February, the weakened polar vortex triggered severe cold outbreaks that surpassed average temperatures, leading to a dramatic spike in heating demand. Notably, for the week ending February 22, degree days in the U.S. were approximately 38% higher than the previous year and 31% above normal, highlighting the severity of the cold snap (aga.org).
These cold events resulted in substantial gas withdrawals from storage and a sharp rise in regional gas prices. “Polar vortex distortion” refers to the disruption or splitting of the stratospheric polar air mass, which can lead to unexpected pipeline freezes. In January, these effects brought historic snowfall to parts of the southern U.S. and record-low temperatures, causing a significant increase in gas consumption for both residential and commercial use.
The U.S. Energy Information Administration (EIA) has updated its forecast for the average benchmark Henry Hub natural gas spot prices for 2025. The EIA now anticipates that natural gas inventories will drop below 1.7 trillion cubic feet by the end of March, marking a decrease of 10% compared to the average levels seen over the past five years. This adjustment also reflects a 6% drop in expected natural gas storage levels for this time of year compared to previous forecasts made last month.
The EIA forecasts that increased natural gas consumption, coupled with lower inventories, will contribute to rising natural gas prices. Specifically, the average Henry Hub spot price will be 11% higher than last month’s prediction. For 2026, the forecasted average price has risen to nearly $4.50/MMBtu, an 8% increase from the prior forecast.
About the Author
 Edward Nikulin, weather model expert in Mind Money, is a proficient quantitative researcher and data scientist with more than 8 years of experience in market modeling, systematic trading, and AI-driven analytics. He is an author of the weather model for proprietary trading strategies of Mind Money.


