


By Gary Yohe
Syukuro Manabe and Klaus Hasselmann were awarded shares of the 2021 Nobel Prize in Physics for scientific work that is both understandable by non-scientists and critical to humanity’s recognition of risks born of human-induced climate change. We now know what they could not know when they started their work – the climatic changes that they revealed are irreversible in human timescales and they produce extreme events that are persistently increasing in frequency and potentially catastrophic intensity.
In October of 2021, Syukuro Manabe and Klaus Hasselmann were awarded a shared “Nobel Prize in Physics” with Giorgio Parisi for their “groundbreaking contributions to our understanding of complex systems”.1 In announcing their award and preparing an accessible document explaining their selection,2 the Prize Committee refocused the world’s attention on climate change by rewarding Manabe and Hasselmann more specifically for their “physical modelling of Earthʼs climate, quantifying variability and reliably predicting global warming”.
Ah! Wonderful. Finally, a physics award for something whose immediate importance to humanity can actually be understood by much of humanity in real time. The award is also reassuring to those who recall that an earlier Prize Committee had already awarded a share of the “Sveriges Riksbank Prize in Economic Sciences in Memory of Alfred Nobel” to William Nordhaus in 2018 “for integrating climate change into long-run macroeconomic analysis”.3
This essay was designed to complement the documentation of the physics award provided by the Nobel Committee4 with contextual commentary that places their enormous contributions about the evolving role of climate modelling and climate science in the global discourse over at least three fundamental questions:
- What do we actually know about the possibility and causes of a changing climate?
- How can we possibly know those things without being able to run controlled experiments on a parallel planet where humans do not emit greenhouse gases?
- And, so what if they do? Why has responding to climate change risk been called humanity’s greatest challenge?
The answers to these questions complicated, to be sure, but they can certainly be informed by a series of applied lessons (highlighted below in italics) drawn from the long careers of both pre-eminent scientists (and Nordhaus, for that matter).
1. Public discourse about climate risk is not new to the 21st century.
The modelling work that brought Manabe the Prize emerged in 1967 with the publication of Manabe and Wetherald5; Hasselmann started his work on climate change “fingerprints” in 1976.6 Nordhaus’s seminal work on the economics of climate change appeared in 1991.7 Enough said. Climate change is not the product of a recent and still speculative conspiracy from a small wing of the scientific community.
Manabe, for example, started down his path to the Prize by demonstrating that concentrations of CO2 could affect temperatures from the earth’s surface up to the atmosphere’s boundary with space, i.e., from the low-altitude troposphere up through the high-altitude stratosphere. He created and exercised a simple linear model in the 1960s that could, on the basis of then current but limited data and computer power, correlate the radiation balance of the planet, not only with respect to surface temperatures, but also with respect to the vertical transport of air masses for different concentrations of CO2.
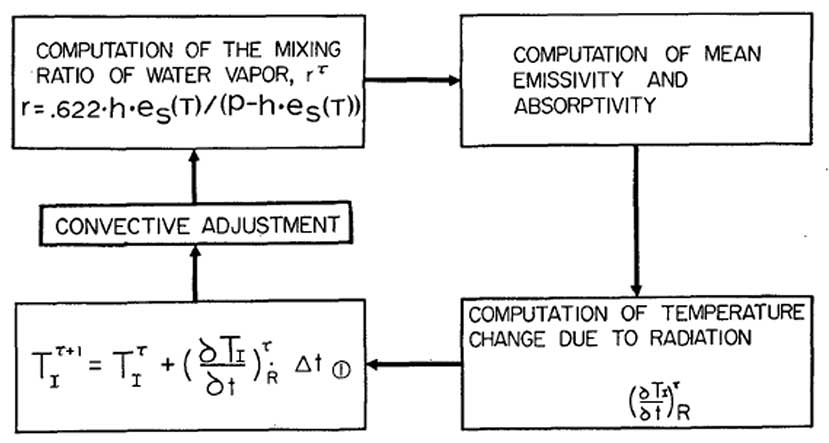
Figure 1 duplicates figure 2 in Manabe and Wetherald. It is their schematic of the modelling structure with which they were able to substantiate an intricate and new story. Incoming solar radiation heats the earth to a degree that is regulated by outgoing infrared heat radiation at a rate that depends positively on atmospheric concentrations of carbon dioxide. Latent heat warms the surface of the earth and thereby creates hot air that rises by convection into the upper regions of the atmosphere. This rising air transports water vapour skyward, but it does not stay aloft as a greenhouse gas. Instead, it condenses and falls back to earth when it reaches the colder upper regions of the stratosphere, and the condensation process itself cools its immediate environs.
2. It is possible and many times advantageous to use models to produce empirical estimates of critical climate parameters.
This sign-switching behaviour along the atmosphere’s vertical temperature gradient was news back then. So, too, were model-based estimates predicting that stratospheric temperatures would fall more than 2.25oC starting at an altitude of about 20 km at the same time as lower tropospheric temperature would rise by about 2.36oC at the surface if atmospheric concentrations of CO2 doubled from 300 ppm to 600 ppm. He could therefore report an estimate of an essential parameter called “climate sensitivity”b that currently lies just below the low end of the most recent distribution from the 2021 contribution of Working Group I to the Sixth Assessment Report of the Intergovernmental Panel on Climate Change (IPCC).8
Has the “falsifiable” prediction of discernable sign-switching across the atmospheric temperature column held up over time? Yes. At a time when the National Aeronautics and Space Administration was reporting that concentrations of CO2 were already 50 per cent higher than they were at the cusp of the industrial revolution (as opposed to 17 per cent higher than pre-industrial levels in 1967),9 the IPCC was concluding that:
- “The troposphere has definitely warmed since at least the 1950s, and it is virtually certain that the stratosphere has cooled.
- It is extremely likely that anthropogenic forcing, both from increases in greenhouse gas concentrations (combined with the depletion of stratospheric ozone) was the main driver of upper stratospheric cooling since 1979.
- It is very likely that global mean stratospheric cooling will be larger for scenarios with higher atmospheric CO2 concentrations.”
These conclusions were reported with very high confidence, even though the National Oceanographic and Atmospheric Administration (NOAA) had long asserted that CO2 accounts for only 0.041 per cent of the atmosphere.10
3. Explanations of patterns in observed climate data are just as powerful in conducting “falsification” tests of a causality proposition for climate variables as the more usual explanations of observed trends.
To explore this insight explicitly, it is convenient to ask how well alternative explanations of a climate phenomenon have been doing in predicting both warming trends and associated patterns in other climate indicators. Not well, it turns out; they frequently cannot explain the associated patterns. For example, natural climate variability has never been able to explain Manabe’s sign-switching pattern for atmospheric temperatures, because temperatures at all levels of the atmosphere would have to warm in tandem, regardless of CO2 concentrations, for that explanation to hold water. Volcanoes, to take another proposed alternative from the 1960s, also fall well short of the mark, because their effects on temperatures are transient and also failed to switch signs along the vertical temperature gradient.
The value of focusing attention on attribution work about patterns as well as trends is one of the most important lessons to be drawn from Hasselmann’s pioneering research on what he calls “fingerprinting” – work from which a fourth lesson was born in 1976:
4. Human activity is the primary cause of detected warming, and so humanity itself is implicated directly as the source of nearly every climate change risk that it now faces.

Figure 2 replicates figure SPM.1 from the IPCC’s Sixth Assessment Report; it is the latest version of the iconic figure that has grown from Hasselmann’s rigorous analysis of the climate system. The jagged dark line running through the pale orange region represents average estimates of the anomalies in observed annual surface temperatures relative to the 1850-1910 average. The orange region reflects the inner-quartile range of temperature estimates for multiple runs of an ensemble of climate models that are driven by all of the hypothesised natural factors that affect temperatures and the additional forcing caused by the observed history of human factors – most notably, emissions of greenhouse gases like CO2. The turquoise region reflects results from the same collection of natural variation drivers from runs that omit all additional forcing from human factors.
What does this visual portrait of a well-founded counterfactual experiment tell us? Quite a bit, actually:
- Manabe started his work during a climate era that was bookended by relatively high temperatures early and a rapid cooling episode caused by the Agung volcano.
The 1970s were the start of a long-term positive trend in temperature anomalies that reached approximately 1.2oC by 2021. - The orange range spans the observed temperature averages for the entire series, but the turquoise range loses touch around 1980.
- The turquoise range also loses touch with the orange range around the turn of the last century.
It is, though, the last insight on this list that has changed how humanity should think about the source of the warming that has been spreading climate risk around the world at an increasing rate for more than five decades. The statistically significant Hasselmann “fingerprint” of human activity is the gap between the turquoise and orange ranges that started around the turn of the century. Support for its interpretation is, with very high confidence, born of the simple fact that the observations line has meandered within the orange range for the entire 171-year historical record.
The Selection Committee for the 2021 Nobel Prize in Physics has done the planet a great service. By placing the imprimatur of the Nobel Prize on the work of Manabe and Hasselmann, they raised the credibility of one last simple lesson:
The earth is warming.
Climate will change even more.
Blame humanity.
Their work leads us to understand why the haiku is true, but there is now one important postscript that lies beyond the scope of their science:
The poor will suffer most.
This article was originally published on 11 August 2022.
About the Author
 Gary Yohe is the Huffington Foundation Professor of Economics and Environmental Studies, Emeritus, at Wesleyan University in Connecticut. As a senior member of the Intergovernmental Panel on Climate Change and convening lead author of multiple chapters and Synthesis Reports from 1997 through 2016, he shared the 2007 Nobel Peace Prize; and he served as vice-chair of the Third U.S. National Climate Assessment.
e-mail: [email protected]
website: gyohe.faculty.wesleyan.edu
References
- https://www.nobelprize.org/prizes/physics/2021/press-release/
- https://www.nobelprize.org/uploads/2021/10/popular-physicsprize2021-2.pdf
- This is, essentially, the Nobel Prize in Economic Science. See https://www.nobelprize.org/prizes/economic-sciences/2018/press-release/.
- Nobel 2021. “The Nobel Prize in Physics 2021”. NobelPrize.org. Nobel Prize Outreach AB 2022. Mon. 14 Feb 2022. https://www.nobelprize.org/prizes/physics/2021/summary/
- Manabe, S. and Wetherald, R. 1967. “Thermal equilibrium of the atmosphere with a given distribution of relative humidity”. Journal of the Atmospheric Sciences 24(3): 241-59. http://climate.envsci.rutgers.edu/pdf/ManabeWetherald1967.pdf
- Hasselmann, K. 1976. “Stochastic climate models, Part 1. Theory”, Tellus 28: 473-85. https://onlinelibrary.wiley.com/doi/10.1111/j.2153-3490.1976.tb00696.x
- Nordhaus, W. 1991. “To slow or not to slow: the economics of the greenhouse effect”. The Economic Journal 101:920-37. https://www.jstor.org/stable/2233864
- Intergovernmental Panel on Climate Change (IPCC) 2021. Climate change 2021 The physical science basis Summary for Policymakers. https://www.ipcc.ch/report/ar6/wg1/#SPM .
- National Aeronautics and Space Administration (NASA). 2022. “Carbon Dioxide” in Global climate change – vital signs of the planet. https://climate.nasa.gov/news/2915/the-atmosphere-getting-a-handle-on-carbon-dioxide
- Buis, A. 2019. “The atmosphere: Getting a handle on carbon dioxide”. Sizing up humanity’s impact on earth’s changing atmosphere. National Oceanographic and Atmospheric Administration (NOAA). https://climate.nasa.gov/news/2915/the-atmosphere-getting-a-handle-on-carbon-dioxide
Alternatively – References
- Buis, A. 2019. “The atmosphere: Getting a handle on carbon dioxide”. Sizing up humanity’s impact on earth’s changing atmosphere. National Oceanographic and Atmospheric Administration (NOAA). https://climate.nasa.gov/news/2915/the-atmosphere-getting-a-handle-on-carbon-dioxide
- Hasselmann, K. 1976. “Stochastic climate models, Part 1. Theory”, Tellus 28: 473-85. https://onlinelibrary.wiley.com/doi/10.1111/j.2153-3490.1976.tb00696.x
- Intergovernmental Panel on Climate Change (IPCC) 2021. Climate change 2021 The physical science basis Summary for Policymakers. https://www.ipcc.ch/report/ar6/wg1/#SPM
- Manabe, S. and Wetherald, R. 1967. “Thermal equilibrium of the atmosphere with a given distribution of relative humidity”. Journal of the Atmospheric Sciences 24(3): 241-59. http://climate.envsci.rutgers.edu/pdf/ManabeWetherald1967.pdf
- National Aeronautics and Space Administration (NASA). 2022. “Carbon Dioxide” in Global climate change – vital signs of the planet. https://climate.nasa.gov/news/2915/the-atmosphere-getting-a-handle-on-carbon-dioxide
- Nobel 2021. “The Nobel Prize in Physics 2021”. NobelPrize.org. Nobel Prize Outreach AB 2022. Mon. 14 Feb 2022. https://www.nobelprize.org/prizes/physics/2021/summary/
- Nordhaus, W. 1991. “To slow or not to slow: the economics of the greenhouse effect”. The Economic Journal 101:920-37. https://www.jstor.org/stable/2233864


